Interpretation and Presentation of Results
By now you will have collected a range of information from different sources on your progress against your outcomes. The next step is to piece these together and analyse the results and report your conclusions on what has happened and why.
In this section we will look at how you can present data on an individual and organisational basis and use this to understand and improve your practice.
1) Presenting data at an individual level using a case example
Case Background:
A survivor “Pam” has accessed one of the services delivering trauma treatment [EMDR]. She has had 15 sessions input, and she reports feeling much better, but she still feels lonely.
‘Feeling better’ is subjective so you ask survivors to complete some reliable and validated measures to help monitor their progress.
When starting and after treatment she completed the CORE-Outcome Measure [CORE-OM], International Trauma Questionnaire [ITQ] and the Work and Social Assessment Scale [WSAS]. She completed the CORE-10 at each session.
a) CORE data
Key observations and findings:
Pam started therapy with a moderate/severe CORE-OM score of 21.
This decreases over the first three sessions however on the fourth score this increased likely due to some reported difficulties she was having with her family.
Her final CORE-OM score was 5.
Conclusion:
- Pam achieved a clinically significant reduction over the course of treatment as there is a 16-point change from 21 to 5. A reliable change is considered to be greater than a 5-point change.
- Pam moved from a Moderate/Severe banding to being in the ‘healthy’ banding.
b) ITQ data
Key observations and findings:
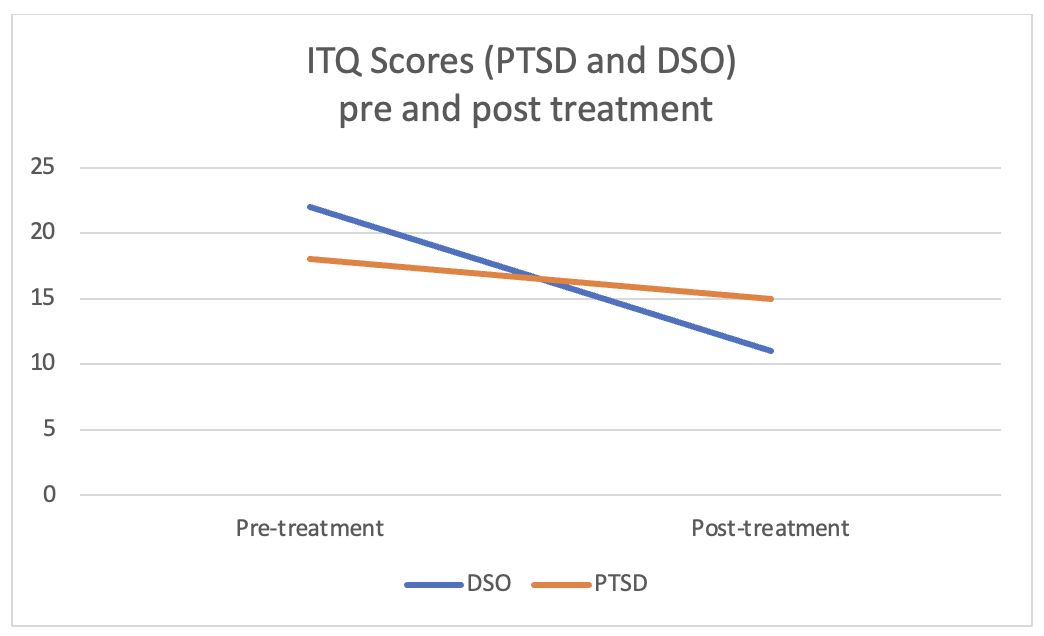
Pam started therapy with a grouped PTSD score of 18 and a grouped DSO score of 22 using the ITQ scale.
At the end of treatment her ITQ data was measured again. NB It is usual to present ITQ data at a grouped PTSD and DSO level rather than for each component.
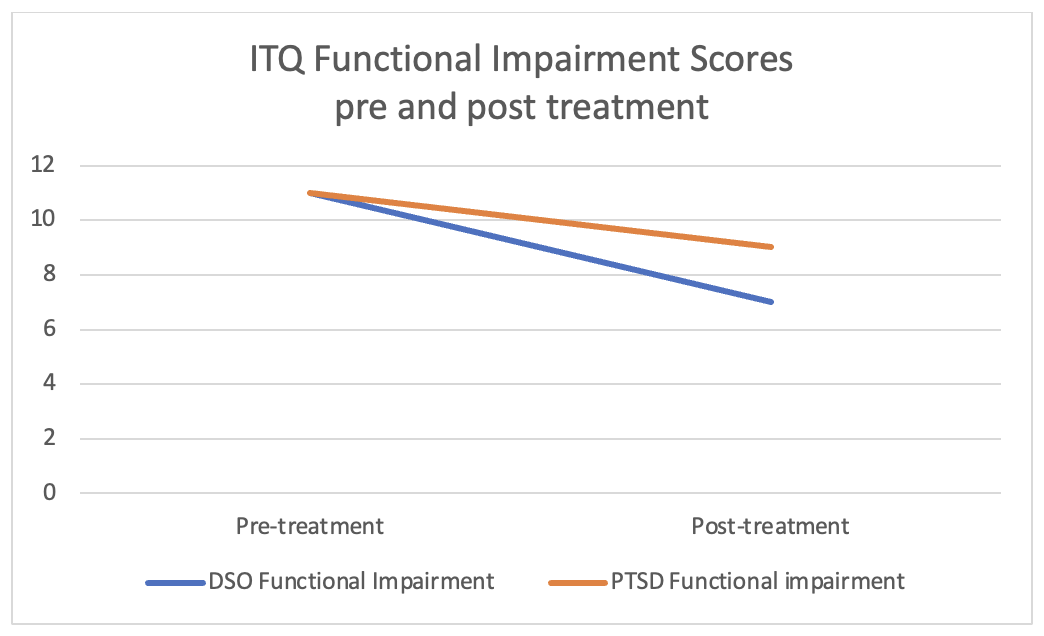
Pam’s difficulties were also impacting on her day-to-day life. This is assessed using the functional impairment questions within the ITQ. As before these are measured before and after the treatment course.
Results are presented below.
Functional impairment scores also improved post-treatment
Conclusion
After therapy, we can see Pam’s PTSD and DSO scores had reduced, although the DSO score had decreased more than the PTSD score.
- Similarly, Pam’s difficulties (PTSD and DSO problems) were also having less of an impact on her day-to-day life (functioning).
c) WSAS data
Key observations and findings
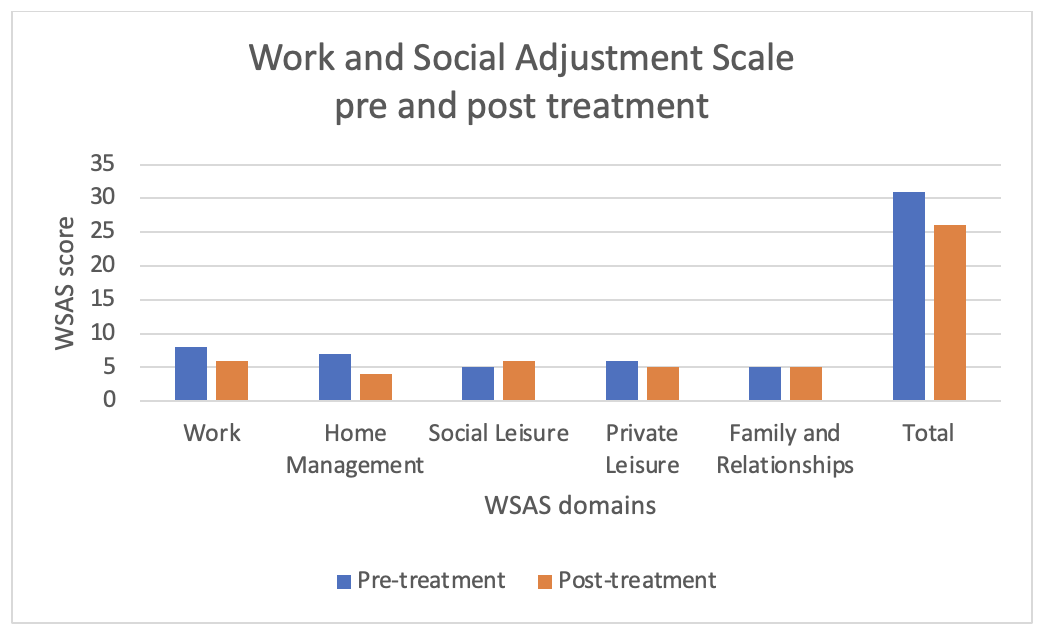
Baseline data across the WSAS scale was taken at the start of treatment and repeated again on completion.
Data in each category allows the therapist to focus activity. For example, at the start of treatment Pam was struggling most in the WSAS domains of work and with home management (managing bills, staying on top of household tasks, etc.).
Conclusions:
Pam has made steady improvement, although it is clear from the WSAS she is not doing many social leisure activities. This information is helpful for Pam and her therapist as they can see how much she has improved and it can help inform a plan for next steps in her recovery, helping her to engage in more social leisure activities.
Overall, therapy has improved Pam’s score has improved by 5 points. Reporting at this level of detail is helpful when comparing across individuals.
2) Presenting aggregate data across a service
Aggregating data allows you to present data effectively across a whole service. This is useful when showcasing the impact of your service to funders or when looking at bigger picture patterns and effects.
If you have data on less than 10 survivors, it is better to report the impact on an individual basis.
In this section, we will describe two common ways to present data on an aggregate basis.
a) Group mean scores
This technique can be used with CORE-OM, CORE 10 and WSAS scores.
The mean scores for each individual at the start of treatment are added together and divided by the number of survivors to create a group mean score. This same process is followed for the individual mean scores at the end of treatment.
Using a prepared spreadsheet, like this one makes the calculations straightforward.
A similar approach can be taken for the ITQ questionnaire by comparing group mean scores for PTSD, DSO and functional impairment rather than one overall group mean score.
These scores can then be presented as follows:
Survivor CORE-OM scores were compared before and after therapy. On average, survivors reported lower mental health and Wellbeing scores before [Mean = X, Standard Deviation = X] than after therapy [Mean = X, Standard Deviation = X].
Standard deviation is a measure of the amount of variation in the results. A low standard deviation indicates that the values tend to be close to the mean, while a high standard deviation indicates that the values are spread out over a wider range.
To further strengthen this data a statistical significance test can be applied. If the results have statistical significance, it is very unlikely to have happened by chance alone.
b) Scoring bands (CORE-OM and CORE-10 only)
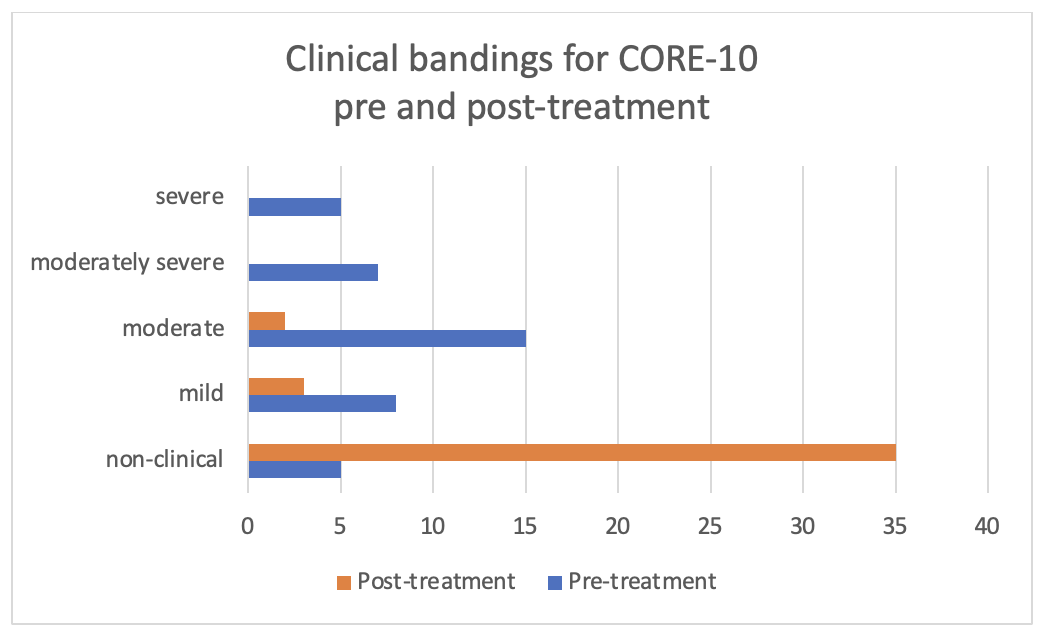
CORE-OM and CORE-10 measurement tools allow grading of response into 5 bands. For further details of the CORE measures see Section 5A.
The bandings pre and post treatment can be compared in a similar way to mean scores above. The progress for a group of 40 survivors is shown in the chart below.
By the end of treatment, none of the survivors are in the severe or moderately severe categories. 35 of the survivors have reached a non-clinical or healthy score using the CORE-10 measurement tool.
This technique is useful to aggregate all survivors and also to analyse the effectiveness of particularly techniques e.g., grouping all survivors receiving EMDR therapy.
3) Reporting your data with clarity
It is important to be transparent in the presentation of your results as this allows greater understanding and learning about the effectiveness of your approach.
Further reading
The Therapy meets Numbers website has a wealth of resources, blogs and useful tips on gathering, interpreting and using data to support the continued development of your practice
The Maya Centre has produced a comprehensive review of its effectiveness in this paper.
Previous
Scoring the WSAS scale
Next
Section 6: Staff Wellbeing


